A Brief History of the USD/CNH Currency Pair
By Harold Murphy
 一个国家的货币显示着这个国家的经济实力,随着中国在世界贸易中的影响力越来越大,资本流动价值不断增长,我国人民币在2015年成为仅次于日元、英镑、欧元和美元的第五大交易货币。数据显示,2018年1月,人民币在国内和国际支付货币中的份额(按金额)为1.66%,较2017年12月小幅微升0.05个百分点,并继续保持全球第五大支付货币的地位。
在人民币市场,离岸人民币的发展也非常迅速,香港作为中国的国际枢纽窗口,是推动离岸人民币市场的首发地。到今天,已经有很多个国家在自己的金融中心进行大量的人民币交易。
反观美元——美元是外汇市场上交易量最大的货币,也是世界主导的储备货币。通过本文,你可以看出有关美元和人民币的汇率波动情况:美元长期占据全球第一大支付货币的位置,但今年年初其在国内和国际支付货币中的份额占比较去年出现下滑,由39.85%下降至38.53%。在3月下旬,人民币兑美元出现了短时的急涨行情。但进入4月后人民币汇率波动加大:连续第三日下跌后却在四月中旬又迎来连续三日升值。近期人民币汇率波动加大的原因主要由于整个市场的波动率都在加大,带动了人民币汇率波动加大。从背后深层次的原因看,中美贸易摩擦从预期层面影响了市场对人民币的投机交易,从而加大了人民币兑美元汇率的波动。
短期来看,人民币因为外部环境的变化而出现升值压力。而更长周期来看,人民币需要成为国际流通货币,在国际上有更大的话语权,则需要保持稳定的汇率,这个汇率稳定不仅仅是对美元,还要对欧元、英镑等。从这个角度上看,人民币长期并没有较大的升值压力,但是需要较为稳定的汇率。
The renminbi, or RMB for short, is the official currency in China while the Yuan represents its basic units. Still, in the international context, the term “Chinese Yuan” is often used when referring to China’s currency.
With China taking an increasingly powerful role in the world’s trade and the value of capital flows growing, the Chinese Yuan became the 5th most traded currency in 2015, only behind the Japanese Yen, British Pound, Euro and US Dollar, and this article intends to provide a brief history of the US Dollar vs. Chinese Yuan currency pair (USD/CNH).
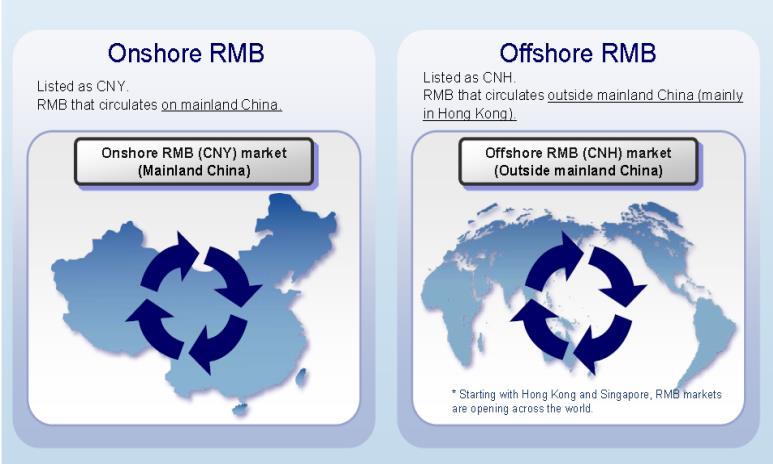
The Offshore vs. Onshore Renminbi
However, there is a notable difference between the two currency codes associated with the Yuan - CNY and CNH – which are the onshore and offshore renminbi. The offshore renminbi – CNH – came into existence with China’s efforts to internationalize its currency by signing currency swap agreements with dozens of countries worldwide, including the United Kingdom, Brazil, Argentina, Canada and Malaysia, to name a few. Hong Kong, being the default international hub of China, was the natural place to launch a market for the offshore renminbi. Since then, Singapore and London have followed and created their own CNH markets and today market participants trade the Chinese currency in all major financial centres in the world.
The onshore renminbi was unpegged from the US dollar in 2005, as a result of China’s transition from a centralized economy to a market economy. Since 2006, the Chinese authorities allowed for a floating exchange rate regime, although only inside a fixed and narrow band against a basket of world currencies. The offshore renminbi, or CNH, isn’t required to trade inside that narrow band which makes it more interesting to analyze its price movement against the US Dollar.
 The US Dollar – Base Currency of the Pair
The US Dollar, on the other side, being the most traded currency in the foreign exchange market and the world’s dominating reserve currency, is a natural counterpart when analyzing the Chinese Yuan, and takes the place of the base currency in the USD/CNH currency pair. This means, the pair shows the price of the US dollar expressed in renminbis, i.e. a rise of the pair reflects a depreciation of the Yuan, while a fall of the pair reflects an appreciation of the Yuan.
The reason for the sharp increase in CNH’s value since its inception was partly speculative in nature as market participants thought the renminbi would increase in value and return to an equilibrium level against the US dollar, driving the demand for the Chinese currency. Previously, the undervaluation of the renminbi – which should have helped China to increase its trading competitiveness – was believed to be as much as 37%.
Technical Picture of the USD/CNH Pair
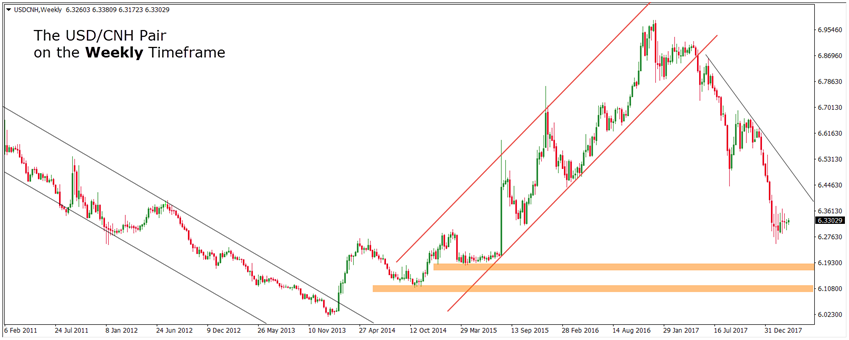
Looking at the technical picture of the pair, the initial appreciation of the Yuan against the US dollar is clearly visible on the weekly chart below, by the falling channel on the left-hand side. The appreciation of the Chinese currency, which began with market participants believing the currency will increase in value as the international pressure on China to increase its undervalued currency rose, lasted almost three years as shown on the chart. During this period, the Chinese Yuan appreciated around 7000 pips against the US Dollar. Part of the reasons for this dramatic appreciation was also the Federal Reserve’s monetary easing, which pushed the value of the US Dollar lower against most of the major world currencies.
The middle part of the chart shows the succeeding depreciation of the Chinese Yuan, represented by the rising channel. The pair made consecutive higher highs and higher lows during the period between late 2014 and the beginning of 2017, until it finally broke the lower channel line.
Finally, the right-hand part of the chart shows the recent fall in the USD/CNH currency pair, which equals the Yuan’s appreciation against its American counterpart. The pair currently trades at around 6.33, and is still around 1,400 pips and 2,300 pips away from the long-term orange support zones, under which the pair should have difficulties to fall below.
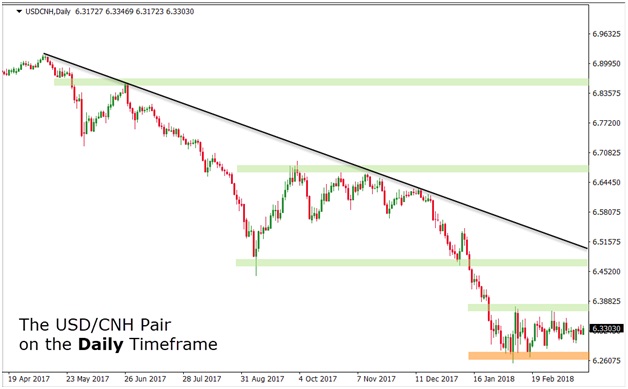
 To look closer at the recent developments in the pair, a daily chart is provided below which basically zooms into the right-hand part of the weekly chart above. As you can see from the chart, the pair is clearly in a downtrend again, with the price making lower lows and lower highs. Resistance zones to the upside are shown as green rectangles on the chart, while support zones to the downside are shown as orange rectangles. In the recent period, the pair is in a consolidation state and trades between the upper green resistance zone and the lower orange support zone. The trading range still equals to around 1000 pips.
Looking at the previous price-action on the chart, the pair tends heavily to the downside, where it should find support again at the orange support zones shown on the weekly chart, at price levels of around 6.19 and 6.10.
 Conclusion
Although the CNH is a relatively young currency when considering its floating regime, the rapid internationalization of the renminbi will for sure add to the attractiveness of the currency and draw international capital. This, in turn, will increase the demand for the renminbi and push its price against the US Dollar (and other major currencies) up, as shown by the daily chart and the downtrend in the USD/CNH currency pair (meaning, less renminbis would be required to buy one US Dollar).

